The other day, my team at PKWARE received a report that the latest version of our library had raised an alarm in their I/O regression tests. I knew that the JDK Flight Recorder could be used to diagnose performance issues, but had little experience with it before. I found limited information about diagnosing file I/O, so I thought I’d share what worked for us.
Table of Contents
JFR fundamentals
JFR uses “profiles” that configure what the recorder should monitor. Mission Control (JMC) calls these “Templates”, but Intellij IDEA and the java option -XX:StartFlightRecording, call them “Settings”. There are 2 settings that are commonly available: a “default” setting that adds about 1% overhead, and a “profile” setting that adds about 2% overhead.
We tried out both settings, but file I/O events weren’t getting captured in the recording. JFR samples events, so if events don’t happen while the profiler is taking a sample, they won’t be recorded.
Build your own settings
Fortunately, it’s possible to build your own settings file. I think the easiest way to do this is using JMC, but you could use a text editor - the file is just XML.
In JMC, open the Flight Recording Template Manager. Start by selecting a running JVM and continue as if you were capturing a flight recording for this VM.
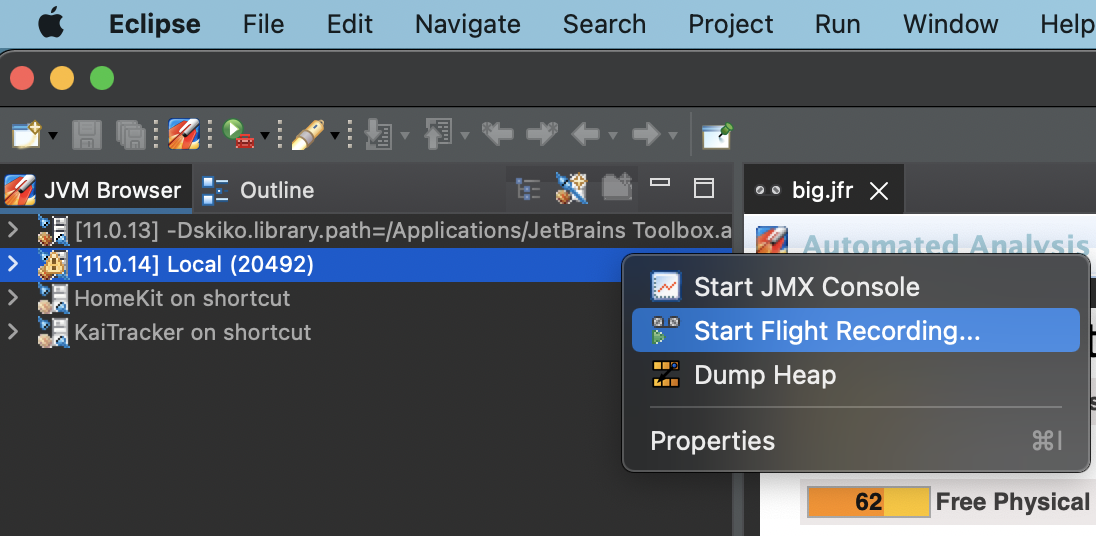
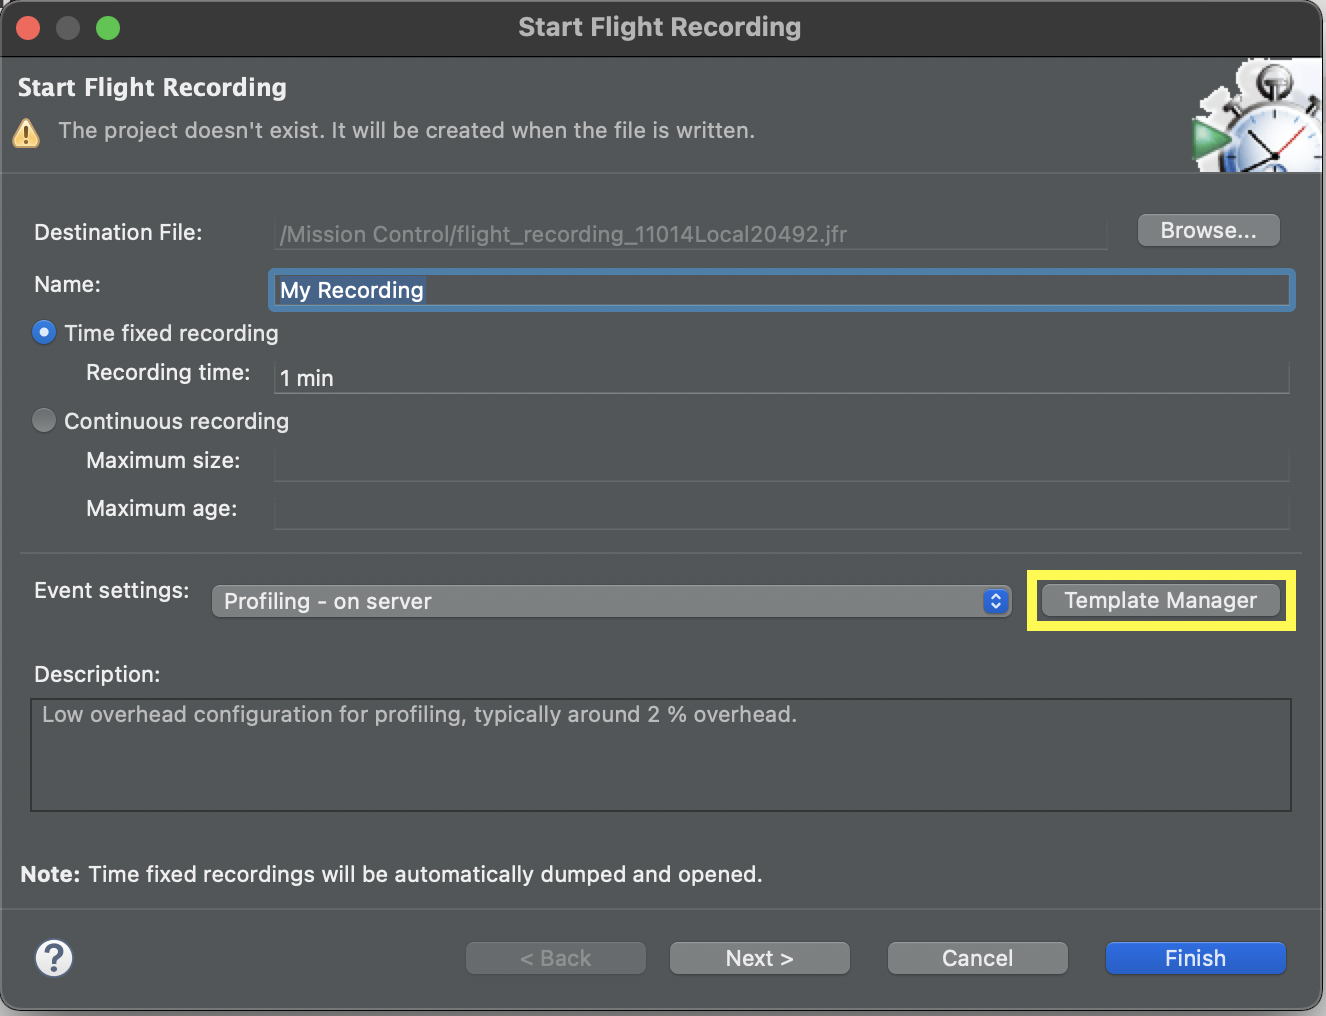
From the “Start Flight Recording” screen, open the Template Manager.
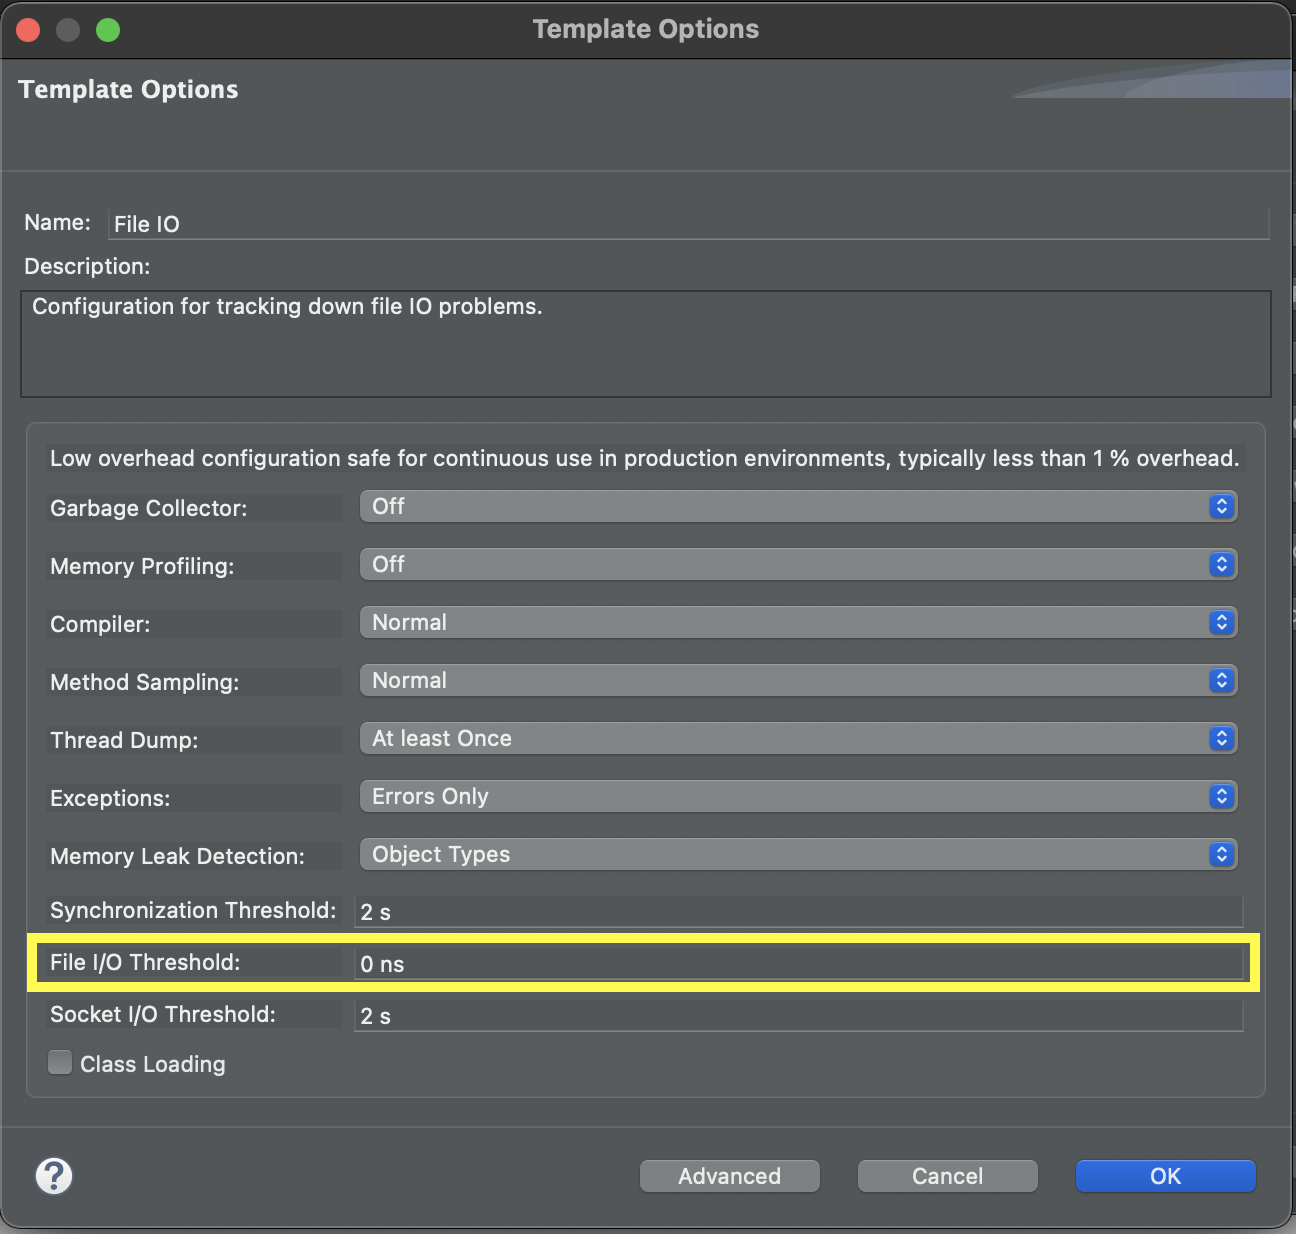
I found it easiest to duplicate an existing template. I disabled most of the major events, but crucially, I set the “File I/O Threshold” to 0 ns. This effectivly tells the flight recorder to log an event for every file I/O operation.
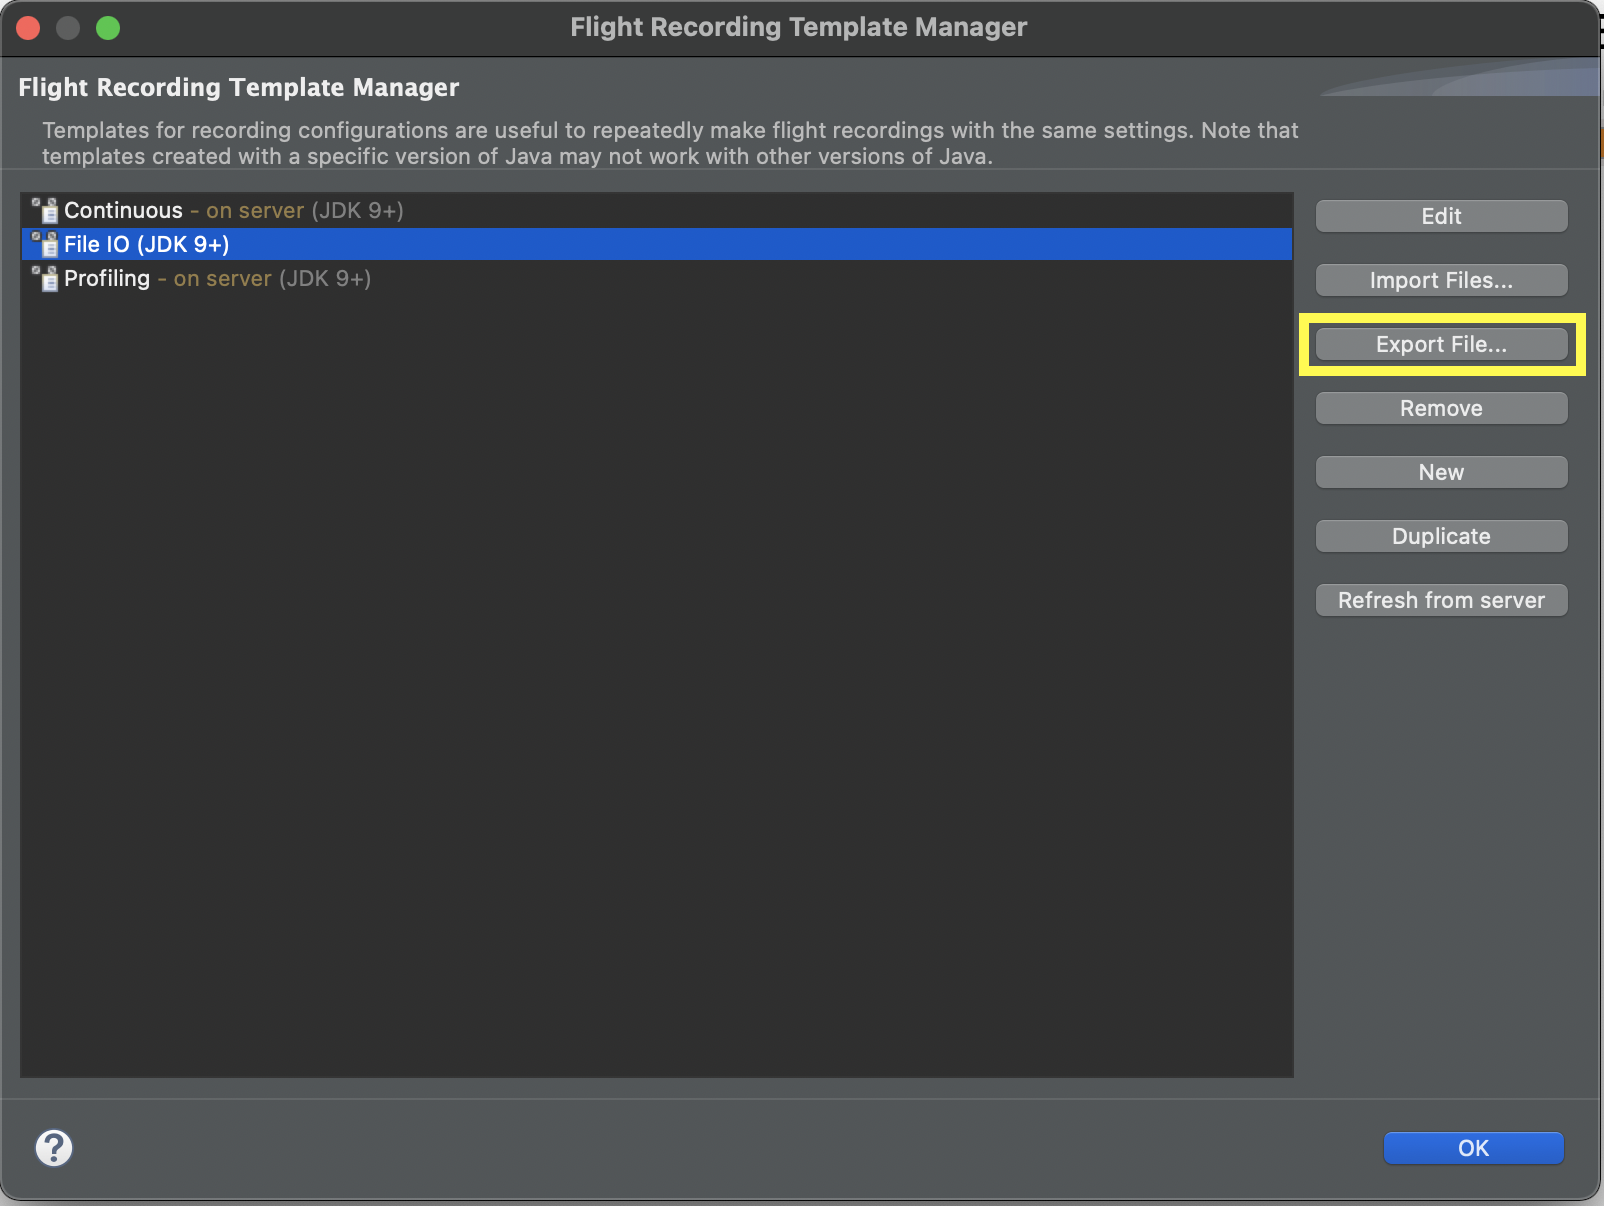
Save your template. At this point, you can proceed to profile using JMC, or, as I did, you can export the template and use it from Intellij.
Using the template in Intellij
Export your template to a file.
Then follow JetBrains’ excellent documentation on how to use and configure JFR in Intellij.
Diagnosis
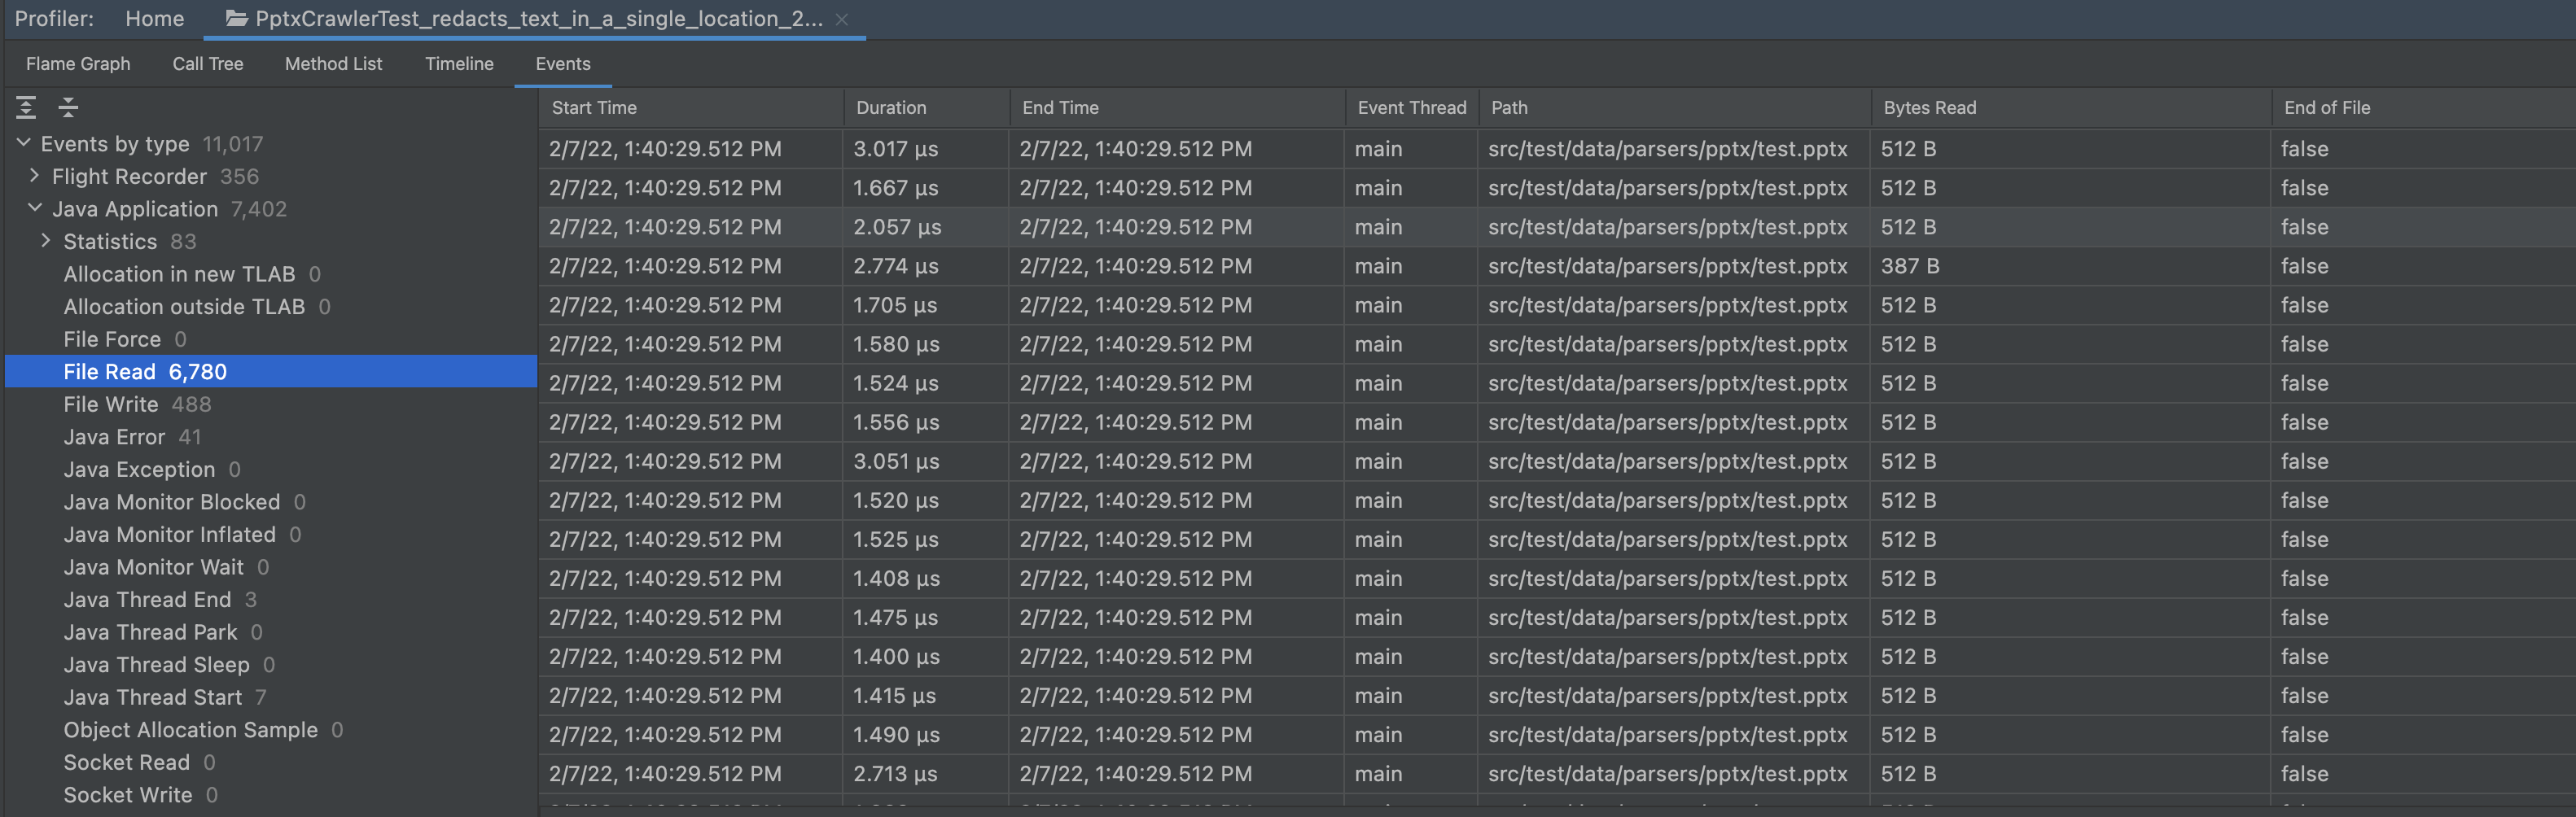 The profile showed many small disk reads: 512 bytes each. A bit of stack walking showed that Apache Commons Compress
 ZipArchiveInputStream uses a 512 byte buffer. It turned out that a BufferedInputStream had been missed.
What’s next?
We’re investigating JFRUnit as a way of catching such problems sooner in the future.
BTW
We’re hiring! Join us in building the libraries that power PKWARE’s data detection and security.